What is Customer Segmentation?
Customer segmentation is a concept that sounds easy at first glance. In short, it is a matter of grouping Customers into different segments, each of them characterized by certain conditions or properties that describe the behavior of the Customers belonging to them.
There are an infinite number of customer characteristics that can be used for segmentation. However, the optimal characteristics and the methodology to be followed will depend very much on the business objective to be pursued with such a Segmentation. Therefore, there is no single correct method and no single way to perform a Customer Segmentation.
In this Blog entry, the idea is to show a practical example of Segmentation using Data Science techniques.
The Utility of Customer Segmentation
In an era in which a retailer, whether local and/or online, has at its disposal such an abundance of data describing its customers, there is no excuse not to put this data to good use and, thus, get to know its customers better and improve their shopping experience.
A Customer Segmentation provides information that allows to personalize much more the relationship with the Customer. In this sense, it is possible to think of personalized offers that increase the efficiency and conversion rate of Marketing Campaigns. Another possible example is to monitor a Customer’s belonging to a segment over time. This information is especially interesting for designing Customer Retention and Loyalty strategies.
Customer Segmentation is often performed using non-supervised clustering techniques (e.g. K-Means, Hierarchical Clustering, etc.). However, from a business point of view, the results obtained from a Segmentation are more effective if the segments can be directly linked to something concrete, such as Customer journey, product affinity, etc.
Therefore, it is essential to interpret the results of a segmentation together with the people who know the business, such as the marketing manager in this case, to ensure that the analysis that has been done makes sense and that the information can be translated into concrete actions that improve the relationship with the customer, improve their shopping experience and, consequently, increase sales.
RFM Analysis
Customer segmentation can be performed taking into account a multitude of different variables, such as demographic, geographic, psychological (preferences, etc.) or purchasing behavior data, which are becoming increasingly important.
However, we are going to present here a basic and practical example, in order to make it illustrative and easy to follow. To do so, we base ourselves on a classic analysis in the world of marketing: RFM segmentation.
Conceptually, it is a matter of segmenting Customers according to three variables: Recency, Frequency and Monetary.. That is, given a particular Customer, the variables to be analyzed are, on the one hand, the days that have passed since the last purchase, on the other hand, the frequency with which the Customer has purchased products in a given period, and on the other hand, the aggregate monetary value that the Customer has spent.
Practical Example RFM Segmentation – Demo
The data behind this example represents the purchases of registered Customers of a Retail chain over a given period. The CSV file containing this data can be downloaded from this link. The data contains, in addition to a Customer Identifier, the three variables previously mentioned:
- Frequency: the number of times a Customer has visited the store during the period under analysis.
- Monetary: the aggregate value (€) spent by the Client in this period.
- Recency: the number of days that have passed since the last visit.
We have developed an interactive Dashboard in R Shiny that can be opened from the following link:
To use the application, just load the CSV file mentioned above.
Although the use of the Dashboard is quite intuitive, we also have at your disposal a document with more precise instructions for its use, which can be opened from this link.
Once the file is loaded, the first tab of the application displays descriptive information about the data, while in the second tab you can create, analyze and even export a Segmentation.
Here is a small video-demo of the application:
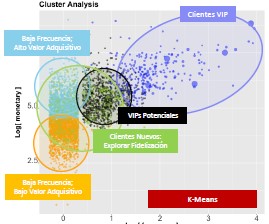
In order to show a concrete example, the following image (Figure 1) shows a Segmentation in which the number of segments to be identified has been set to 5:
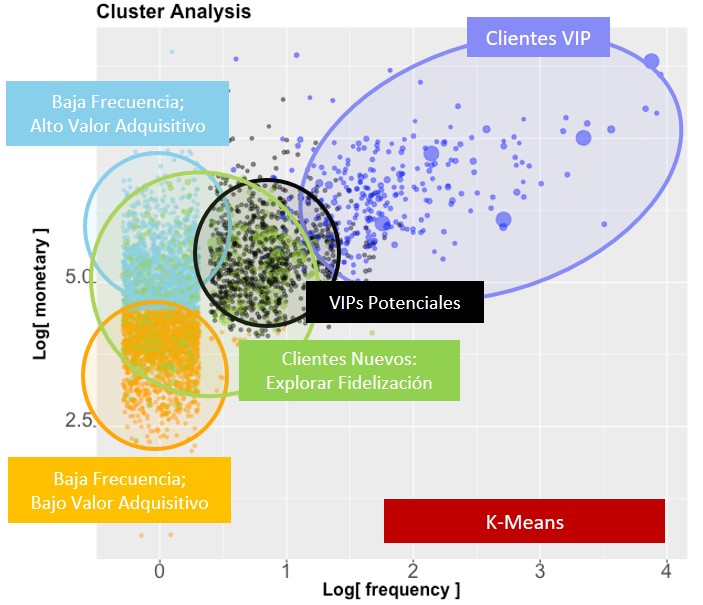
From a Marketing point of view, each segment could represent a group of Customers with the following characteristics:
- VIP customers: Customers with high frequency and high purchasing value. These customers are very important for the business and cannot be lost, so we must try to design strategies to keep them as loyal as possible.
- Potential VIPsCompared to the previous segment, these Customers have a lower frequency and monetary value, although significant. A Marketing campaign could be designed in order to “push” these Customers towards the VIP segment.
- New CustomersNew Customers: Customers who have recently visited the store for the first time (low Recency). We should try to convert them, at least in part, into more frequent/loyal customers in the future.
- Customers with Low Frequency, High Recency, and High/Low Acquisitive ValueHigh Recency value indicates that it has been a long time since the last visit. Coupled with their low frequency, these Customers could be considered practically lost, as they are unlikely to return to the store. In this case, Marketing initiatives could be designed to attract their attention back to the store and its products.
Although the interpretation of the segments always has a subjective component, there is no doubt that this information can bring great value to the Company.
For example, another important practical application to increase sales would be for the Sales Department to design a “Focused or Personalized Marketing Campaign” for existing segments, i.e., offering and encouraging each Customer with those Products or Services that are most likely to be successful according to the segment to which that Customer belongs.
Try it yourself!
We suggest you to explore and use the application using our test data, but there is nothing more interesting than analyzing your own business!
Therefore we encourage you to use your own data, as long as the CSV used has the same format and column order as our test file.
Regarding data privacy, if they are anonymized beforehand, you will not have a problem, but also, once the session is over, the CSV used is deleted and no trace is left.